Notre banc d'essai (brevet en cours)
Veuillez vous connecter (en haut à droite) pour voir la documentation pré-commerciale en entier.
Thank you.
Webmaster
The product: vacuum adjustment by section
Vacuum settings by section

The vauum settings in our system are currently:
1/ in the "fuser" from 5 cm3 to 500 cm3: 50 µBar to 1 milliBar
2/ in the (3) liter stabilization bottle: 15 µBar to 1 milliBar (without turbomolecular pump)
3/ in the auxiliary bottles: 50 µBar to 1 milliBar
The Material
Our test bench includes:
(1) 1 x 10 µBar vacuum pump (optional turbomolecular pump); this has temperature protection and automatic shutdown at a temperature of 60°, and a 5-second timed shutdown;
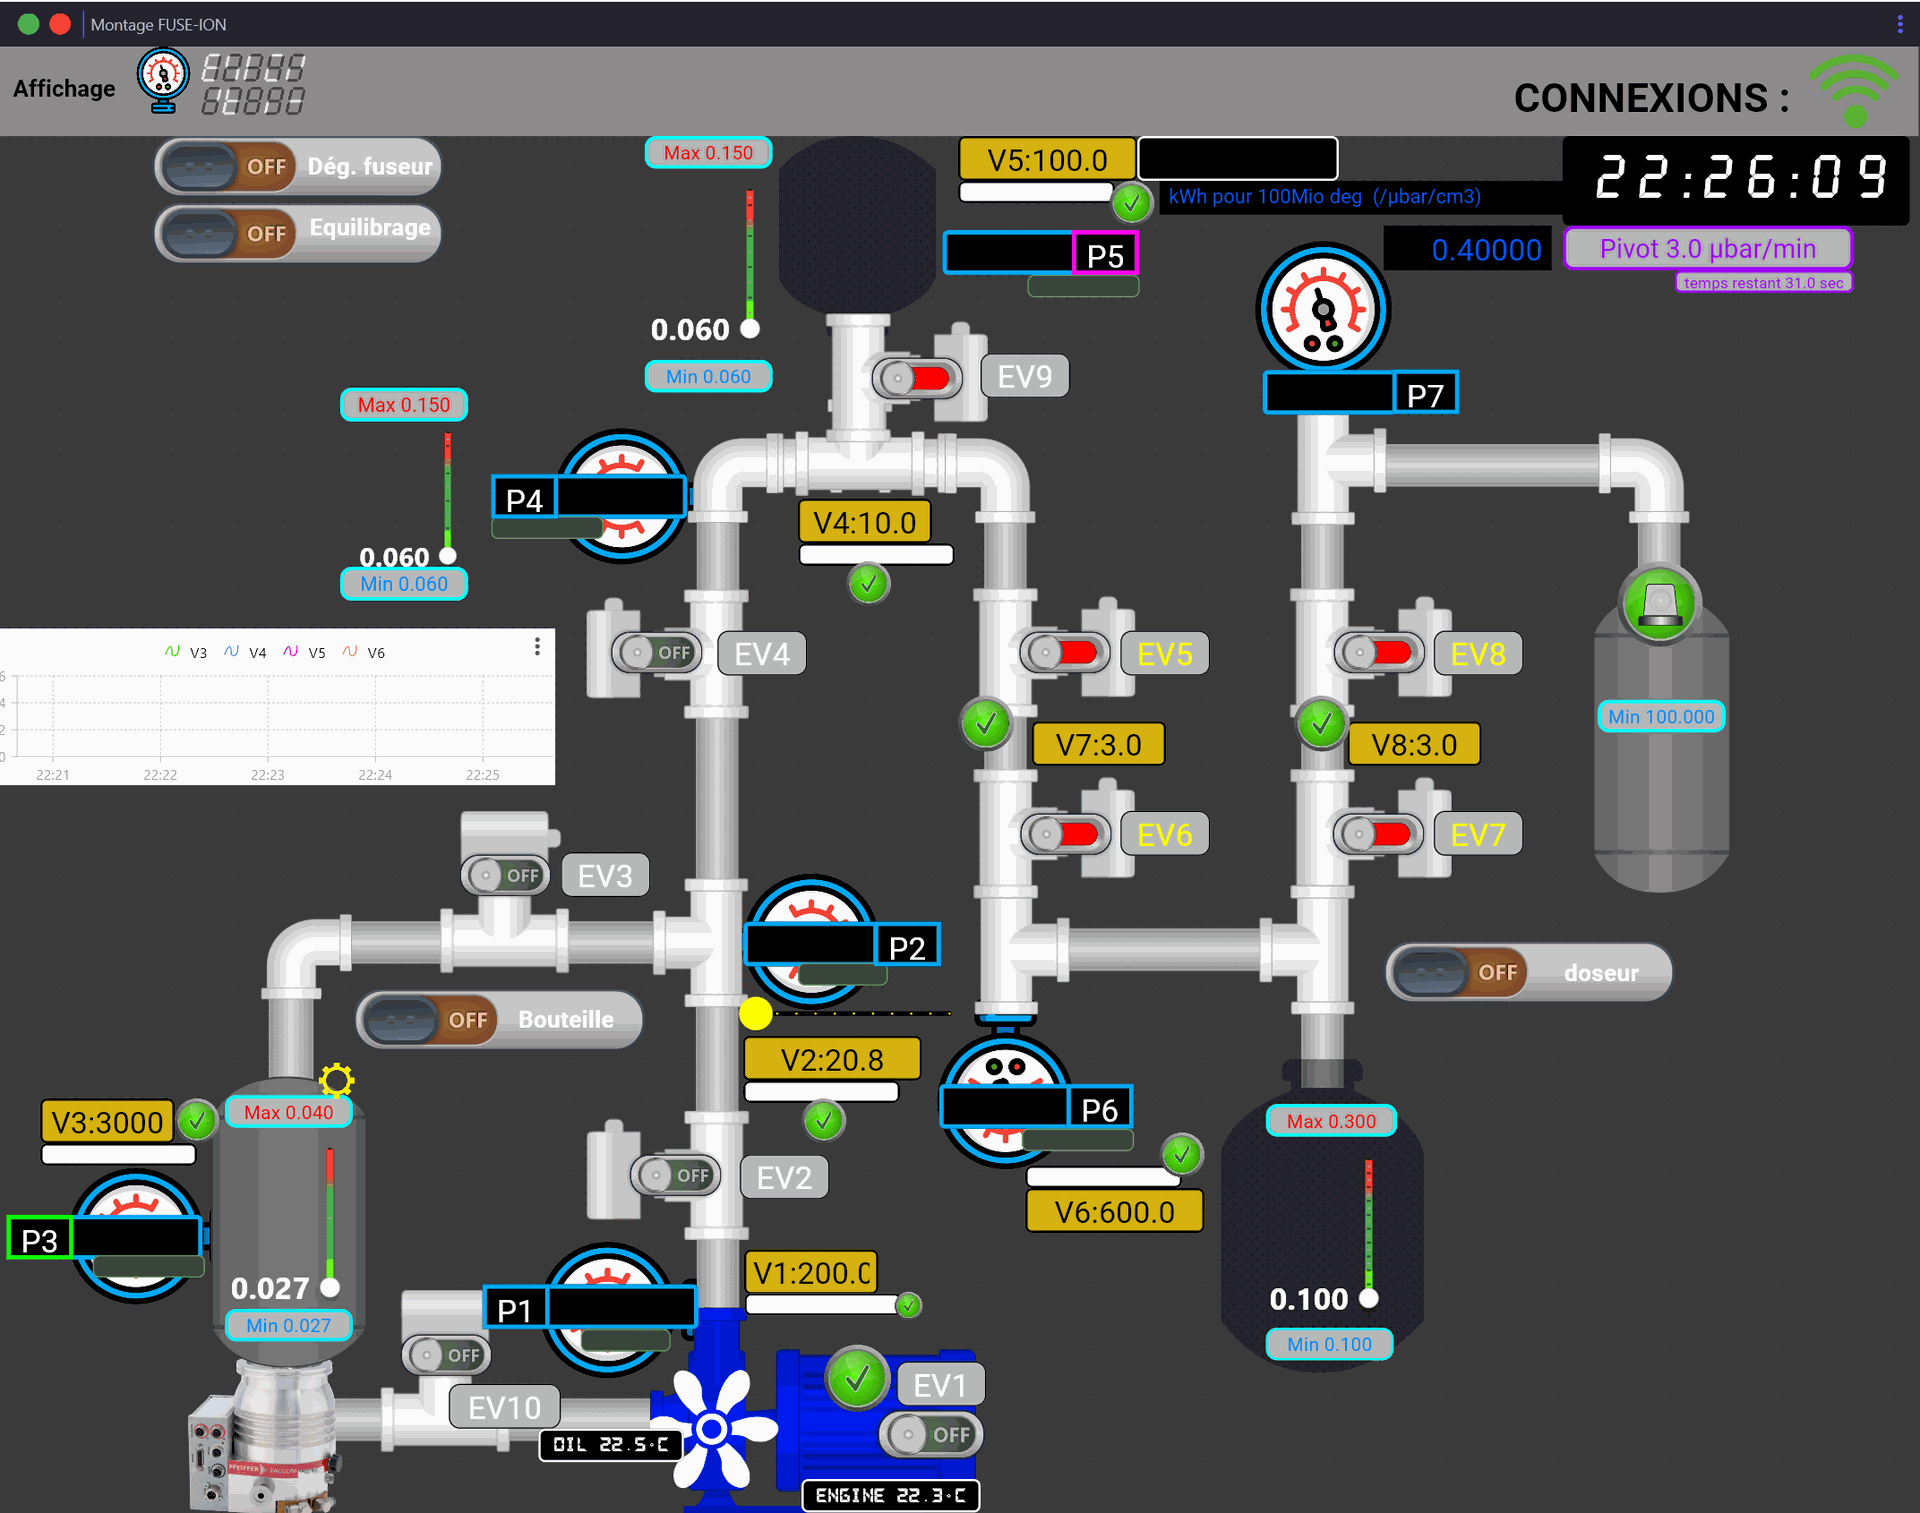
(2) The technical assembly as described in the image, including a 3 liter bottle;
(3) a spherical borosilicate glass tank 10 centimeters in diameter (other size optional);
not included:
hydrogen degassing bottle or other;
the "fuseur": we have several mini models, spherical from 5 to 20cm in diameter in glass
a turbo-molecular pump (and adjoining EV10)
1 220V power supply box with:
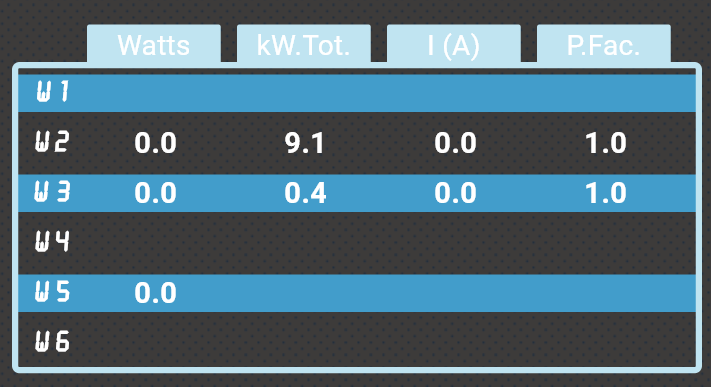
- 6 220V channels with electrical data measurements: P instant, cumulative, reactive, power factor, etc.;
- Currently recording 15 seconds
- 6 220V NO-NC relays, 8 Digital Inputs, one RS485 port
1 control box for:
- 8 PT-1000 type temperature probes
- expansion to a total of 90 temperature probes
Vacuum Measurementssures :
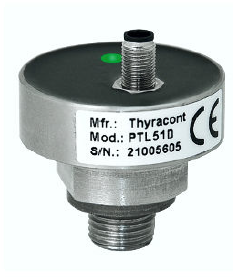
- 8 digital vauum gauges:
- without direct display
- accuracy 5 x 10⁻⁵ mbar
- RS485 connection
- options :
- 2 Integrated programmable trigger relays
- direct display with exponent
- Real-time data monitoring and storage (per second).

The database
Data is read every 15 seconds from the vacuum sensors and temperature sensors, as well as the energy meters. A total of 85 data points per 15 seconds;
Each change in state of the solenoid valves (motorized or solenoids) is sent to the database, time-stamped;
The test bench comes with a one-year subscription for storing 66 million data points , which means sending data almost continuously for a year.
The database can be:
- shared
- private online or local
- with doubled AI analysis, doubled AI automation, etc.
- with matlab
Data Display
A simplified graphic chart is made available, positionable and scalable;
All recorded data can be displayed at the sensor unit, or in competition with others;
Tools are added to enhance the documentation:
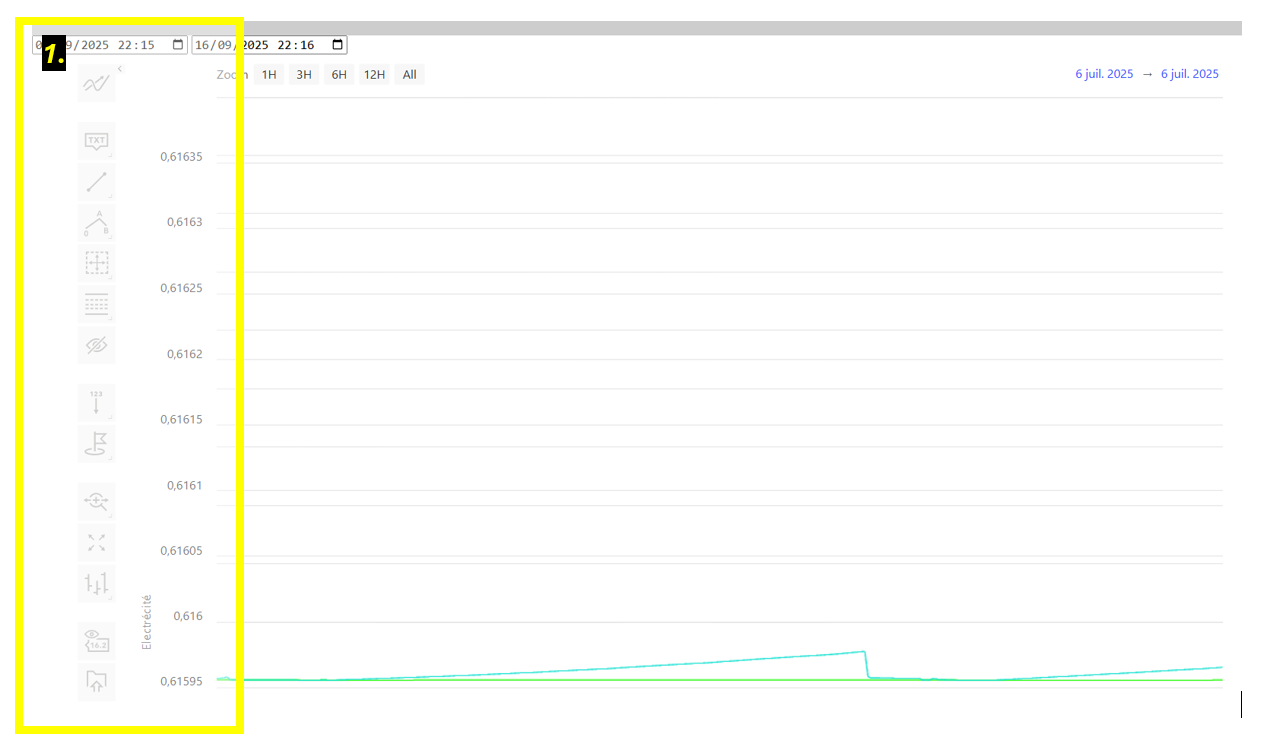
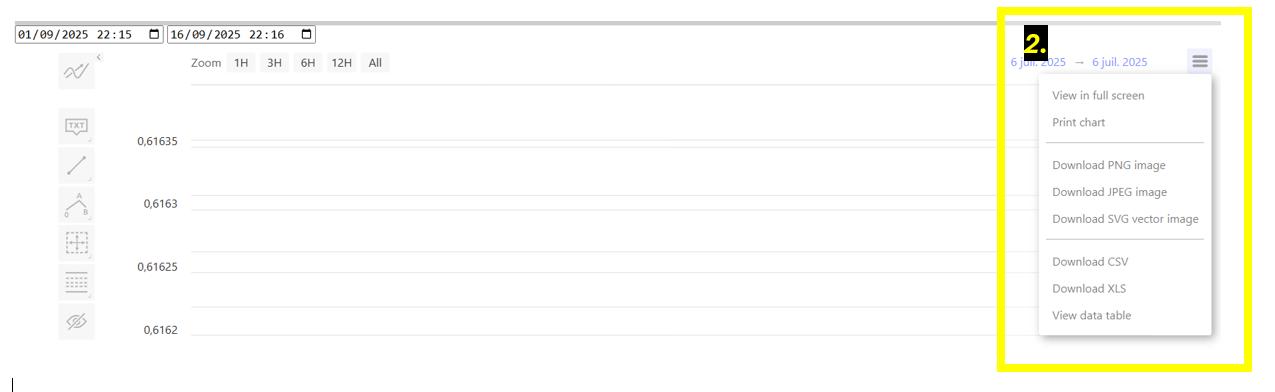
Several elements of the series together:
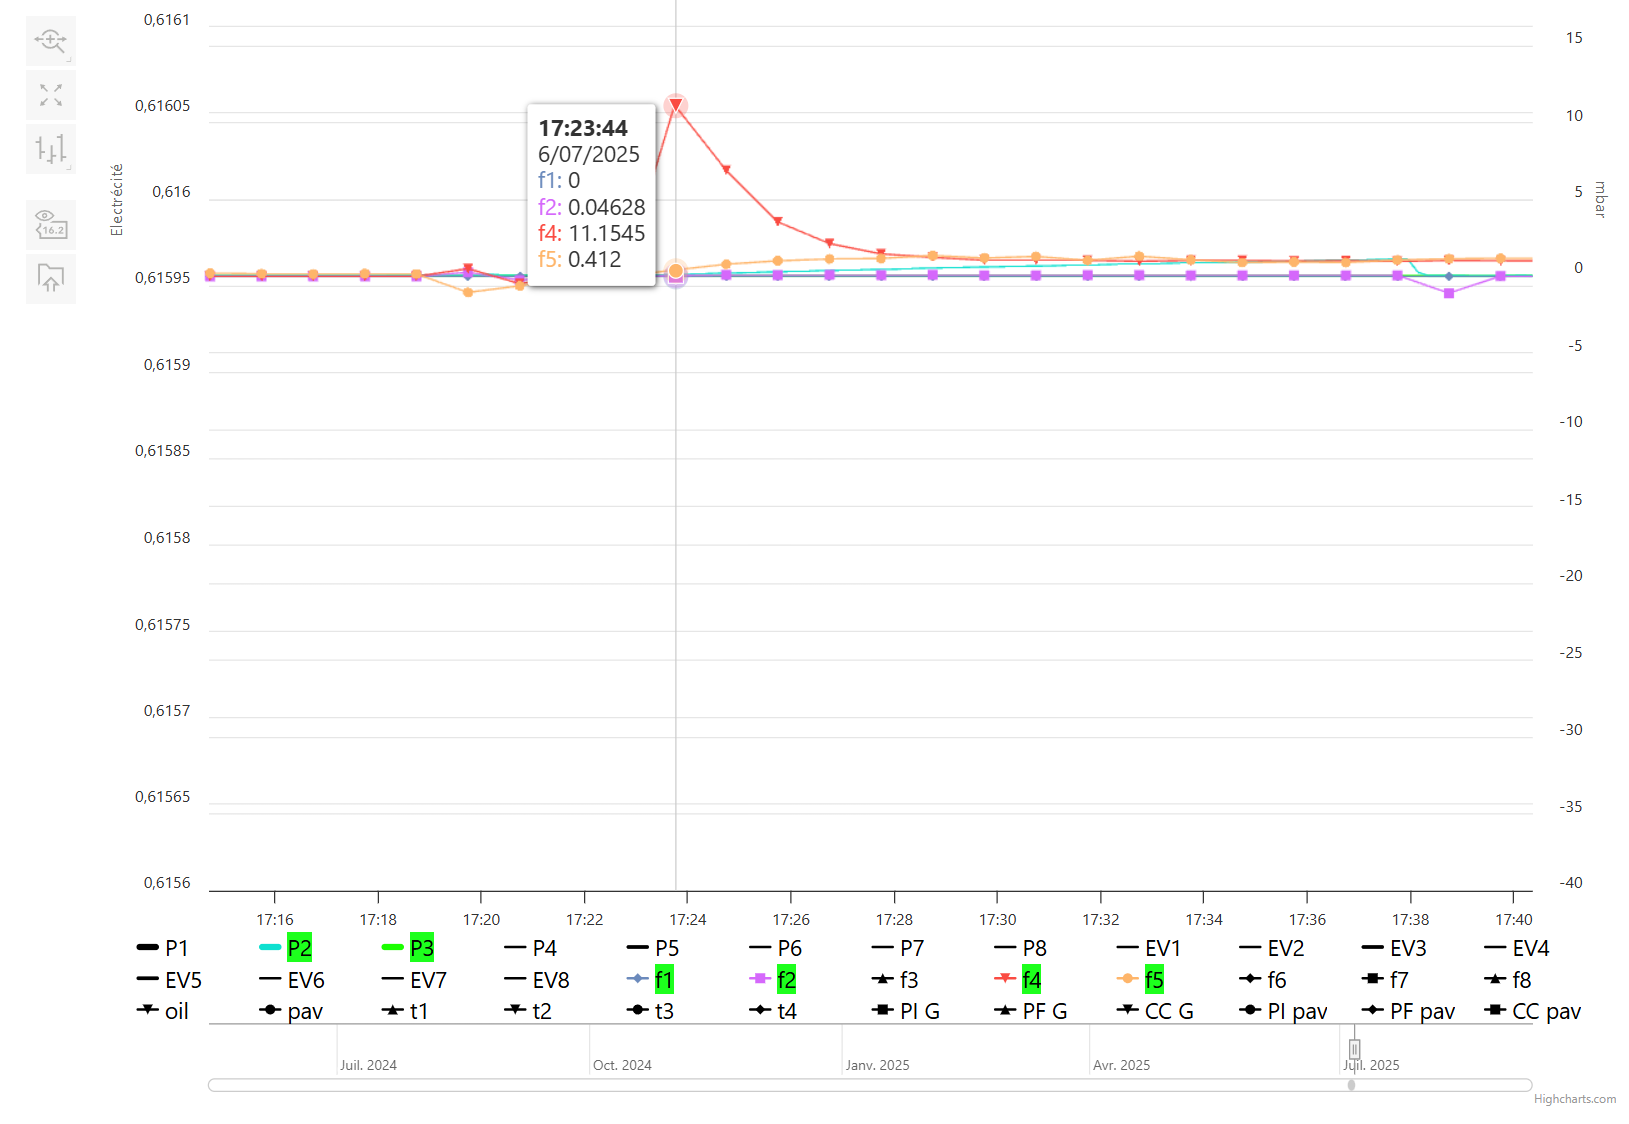
Sliders exist to increase the resolution of the displayed data;
Data can be doubled with labels: mini display with unlimited number per screen, over 5 minutes in real time: (currently being redesigned)
HMI interface
The test bench has a control interface with several display types.
(currently being redesigned)
1 screen with the test bench synoptic, control buttons and a visualization of pressure data at different points/sections;
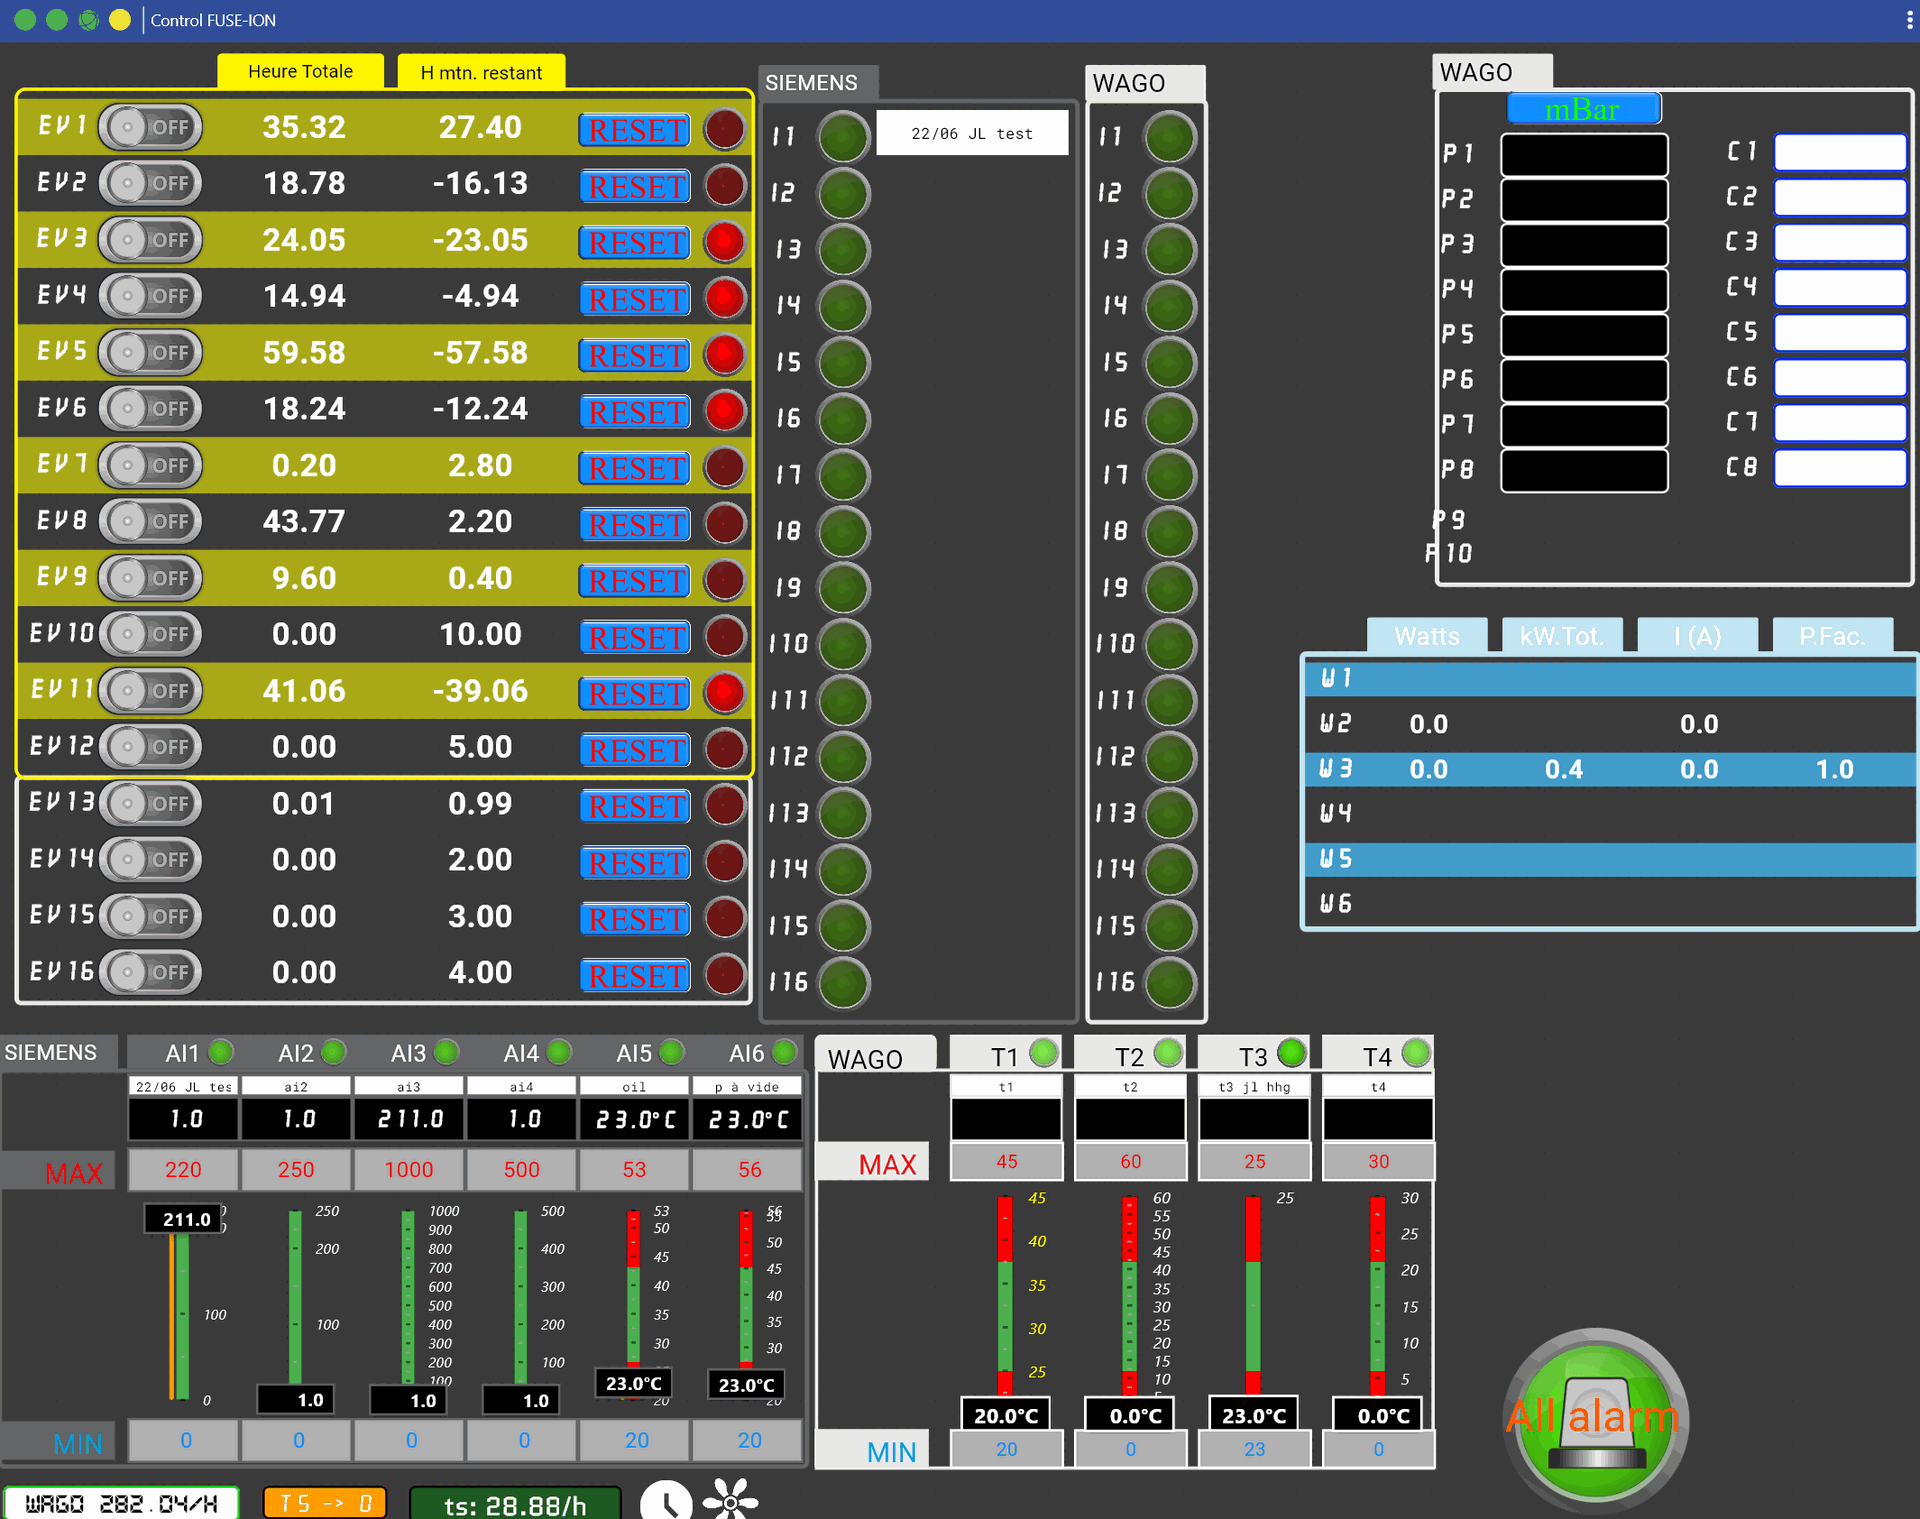
1 screen per PLC, with direct control of outputs and visualization of inputs.
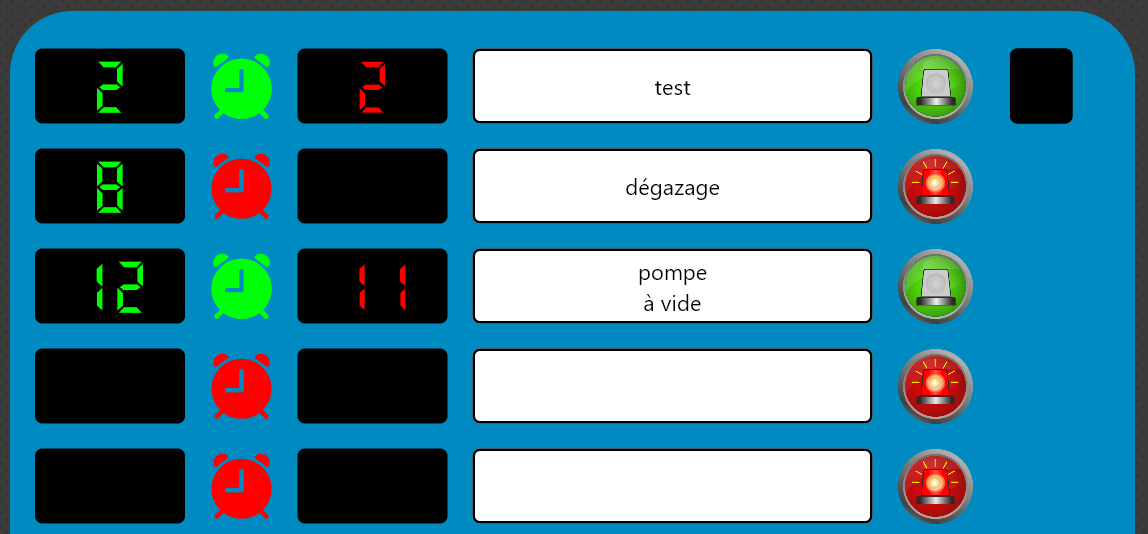
Monitoring the operating times of the outputs, for example to count the time remaining before maintenance of the vacuum pump (its oil); (currently being refurbished)

Bar graphs with the possiblitity of directly set threshold alerts, by temperature input, analog input, etc... automatically saved; (currently being redesigned)

Built-in tracking graphs, with multiple real-time display options;
1 monitoring screen, with control and graphs, of data fromeach controllable power outlet; (currently being redesigned)
with some programmable timers programmables sfds for manual tass to check, free and automatically saved descriptions, unlimited number (on request): (currently being redesigned)
Our services
1/ We provide training on high-end HMI interface design system:
- to adapt, control, add elements,
- logical conditions,
- new sensors,
- new machines from A to Z.
examples of widget elements:
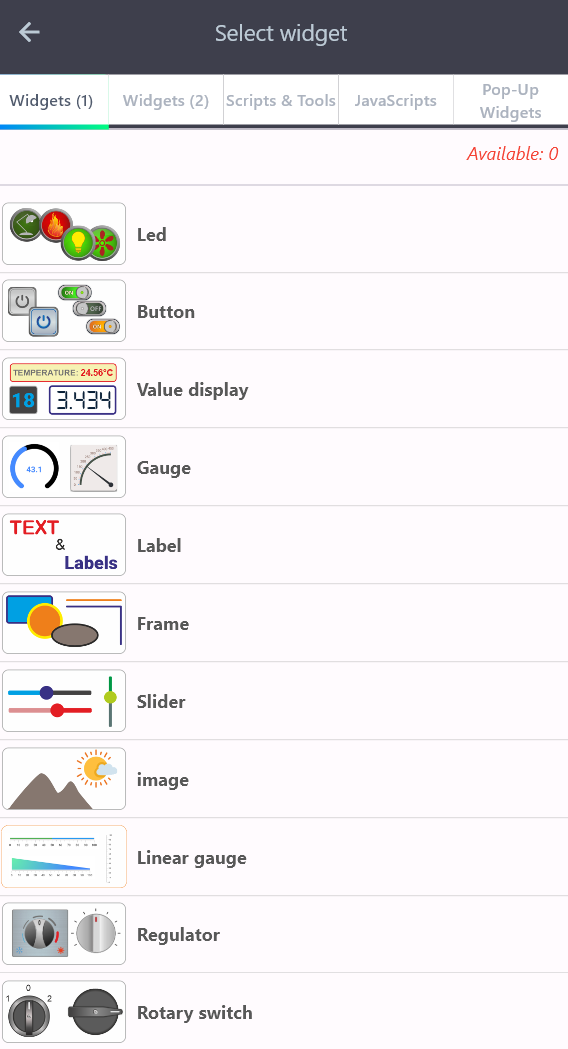


If training is not suitable, we can produce all interfaces from A to Z for all RS485 or TCP modbus RTU PLCs on the market, as well as any peripheral on these protocols (ESP 32, etc.).